
Within the dashboard’s filter section, users can access 5 Quick Filters designed to enhance usability and streamline data analysis. These filters make it easy to adjust the data displayed—allowing you to focus on specific timeframes, roles, or other key criteria with minimal effort.
Whether you’re managing a single project or multiple accounts, quick filters provide a fast and flexible way to track survey activity, monitor engagement trends, and surface the insights that matter most.
The 5 Quick Filters
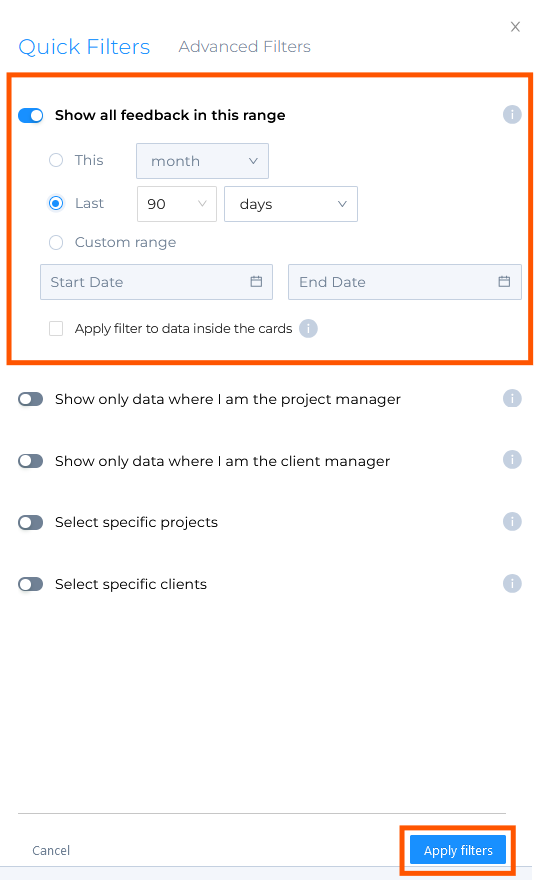
- Show all feedback in this range
- This filter allows you to view data based on a defined time range. By default, it shows feedback requests sent within the past 90 days.
- Preset Ranges: Use the dropdown next to "This" to select options like This Month, This Quarter, or This Year (measured in Days, Weeks, Months, Quarters, or Years).
- Time Unit Selection - Last: Choose “Last” and enter a number in the box to the right of it to specify how many Days, Weeks, Months, Quarters, or Years to view. Use the dropdown to select the time unit.
- Custom Range: Select specific start and end dates using the calendar tool under "Custom Range."
- This filter allows you to view data based on a defined time range. By default, it shows feedback requests sent within the past 90 days.
After selecting your preferences, click Apply Filters to refresh the dashboard.
Show only data where I am the Project Manager
This filter limits the dashboard to display only data from projects where you are listed as the Project Manager.
Show only data where I am the Client Manager
This filter limits the dashboard to display only data from clients where you are listed as the Client Manager.